JP Morgan is a stock in the news because of earnings so we are going to do a quick example to show the power of the Hidden Money Methods.
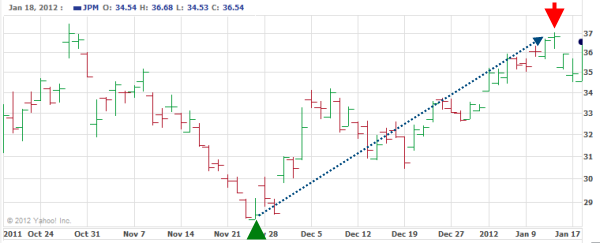
Below we have a simple chart of JPM over the past three months. At the green arrow we have the perfectly timed entry by you the investor at $28.48. We have the red arrow as you well timed exit today. You entered at $36.85.
That is a $8.37 in 50 days. It is a nice 29.4% return.
Most of us would not have been that lucky, but this is just for example purposes.
Now Hidden Money Method #1 would allow us to use only $10.5 of capital vs the full $28.48. On that same exit day $17.5. That is a gain of $7.00. Not quite as much as the full stock price, but in percentage terms that is 66.7%.
If you had added Hidden Money Method #2, you could have added another $0.96 over the same time period to the $7.00. That would make $7.96 on a $10.5 investment 75.8% return.
Learn how to use the Hidden Money Methods in your own Portfolio>>>>
